Blog #23 “Associations”
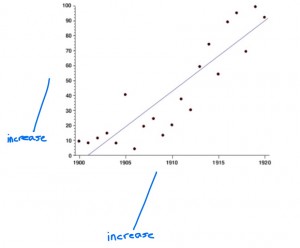
In a graph, you can see if there is an association if you lat at the common direction of the points. For example if you see the points increasing on the X axis while the points increase on the Y axis there is a positive association between two sets of data. As you can see, both sets of data are increasing.
Blog #24 “Slope & Steepness”
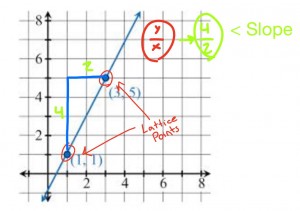
To find the slop of a line on a graph you have to use lattice points. Lattice points are placed on a line every time it goes through a point on the graph. Once these points are placed on the line, you can connect them and count the spots between them. Remember that one you have the numbers for your slop you have to make the y be over the x (y/x) or call it rise over run.
Blog #25 “Line From Data Points”
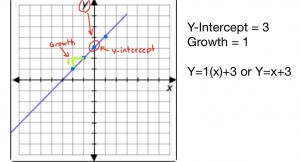
To get a y=m(x) + b equation from a graph of points you need to know the constant growth and the y-intercept. You can find your constant growth by looking at by how much each point is separated. And to find your y-intercept just look at the point located on the y axis. Finally, you just need to construct your equation.

Blog #26 “Describing Association”
The things you need to make an association to a graph is the y-intercept, the slope, the table, and the y=mx+b. An equation in y=mx+b form tells you the slope because the slope is the growth (m) in the equation. An equation may be easier to find the slope than finding it on the graph. The (m) form will tell you if its either decreasing or increasing. Also, to find the slope you can always remember to use the rise over run method.


Leave a Reply