Associations
A graph can help find an association between two sets of data since at one point the data will meet each other. When there is not an association the points or lines in the graph never cross or meet. An association can be when the two lines of data meet or when both follow the same patterns. Another thing to know about are outliers, an outlier is a coordinate of data that doesn’t follow the rest of the points; this makes it lie outside of the rest of the points’ steady growth.
Slope and steepness
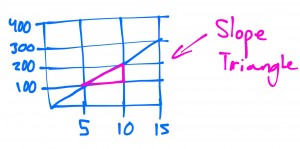
Slope is just another method to use when finding the growth of a graph. Slope is calculated by taking two pairs of coordinates and finding the rise and run, basically how much it grows given a certain amount. For example, in my graph I used a slope triangle to find the slope. For every 5 units it grows by 100; making the slope 100/5. If the line was steeper that would mean the slope is a decimal since it is a more complicated growth.
Line from data points
If you were to find the equation of a line you can once again use the slope triangle; my personal favorite. The equation is y=mx+b , the mx standing for the growth and the b standing for the 0/y intercept.
The growth is 7 and the y intercept is 3, now we just put them together. Now we have our equation, y= 7x + 3. That was easy wasn’t it?
Describing association
There are four things to take into consideration when describing an association. Slope, positive association, negative association, and growth. The slope is basically the graph itself and is vital to describe. A positive association is when the graph is increasing and negative association vice versa. The growth is one of the most important since it determines wether or not the values are increasing or decreasing. The slope can tell you everything within a graph, as long as you calculate correctly.


Leave a Reply