Blog #23
“Association”
We can tell where the association between two sets of data is by looking at the coordinates in the graph where the lines intersect. An association is where they have the same solution that makes the two equations true. If there is no association than it will not intersect and the solutions will not be true statements. The forms an association might have is same slopes or greater and equal inequalities. An outlier is outside of the line or its outside the region that’s defined by the inequality.
Blog #24
“Slope and steepness”
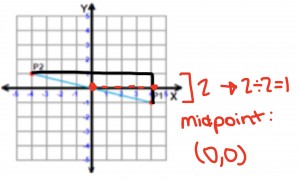
The slope of a line is the ratio f the amount that the y increases as the x increases some amount. Slope tells you how steep a line is or how much y increases as x increases. When calculating slope, if the line runs through a couple of points of the scale, you choose two, which are known as lattice points, and then you have to count how many spaces away they are apart. You calculate the spaces going upwards or downwards, and then left or right. From there, you will make your slope in the form of a fraction. For slope, the y axis comes before the x, so the y goes on top of the x. The y portion of the fraction, is how many spaces each point is apart going up or down, and for the x, it’s how many spaces each point is apart going left or right. If the line were to be steeper, the value of x and y would increase because the more space there is between each point, the more value x and y have.
Blog #25
“Line from data points”
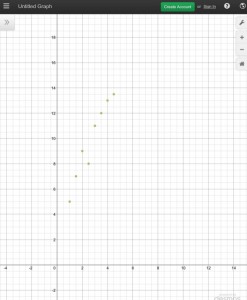
The equation y=mx+b can be found to identify the table of a graph. Since we know that “b” represents the beginning of a graph (which is 0) we will first have to look for which number goes with o. After we find that we look for the growth since “m” equals growth. Once we find that it’ll give us our equation. Here is a graph that corresponds with the steps
Blog #26
“Describing Association”
What do I need to consider when determining a association? Well first you need to make your that the points are clearly going in a direction, you must know for sure that the points are going in that direction. Next you mist think how many outliers there are it is normal to have about 3-5 but if you have 6+ your data might not have any association what so every or your data does nit make sense and you need to revise it. The third think you need to think about is it going a positive direction or a negative direction. This is super important because when labeling an association you can end up messing up the answers causing it to be the wrong and it needs to be corrected. The last thing you must determine is wether there is enough data to label it an association, many times people might not realize it but you need to make sure you have the correct amount of data to help prove a good point that is even has an association.


Leave a Reply