Blog 23: Associations
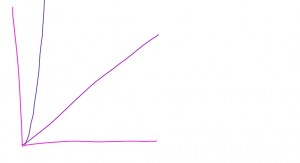
When there is a association in a graph you can tell from when a point increases and then a next point will and then it will go on from them. There is also a negative trend or a positive trend, when there is a negative trend it goes left to right going down, and then for positive trend its from right to left going up.
Blog 24: Slope and Steepness
In a graph there are two things called a slope or steepness, a slope would be when you calculate it into a form similar to like a linear equation which would be y=mx+b, there is also something called lattice points, you will only place the points when they goes through a point on the graph. Steepness is very simple its just when you can see how steep a line on a graph is going.
Blog 25: Line from Data Points
The line of a equation on a graph can be y=mx+b, in those equations on graph to find b you would have to look at the starting point, and then to find the x you would look at the growth on the graph. When you’re looking at the data points to find the distance between them you can just calculate the distance.
Blog 26: Describing Association
To make an association in a graph you need to find the y-intercept , slope, table, and y=mx+b. After you find all of those the one that would help the most is the equations form because it will help you find the slope, when you find the slope you will automatically know the growth.


Leave a Reply