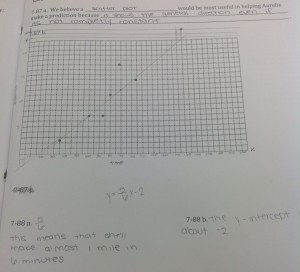
Today in class we learned to tell of there is a association between two sets of data. To tell if there in one you have to graph and side the points and they need to be going in one central direction. The direction can be positive or negative, it wont matter as long as the points are grouped together. You will know there is not trend because the points will be scattered not clear enough to see the direction they are going in.
Blog #24 slope and steepness
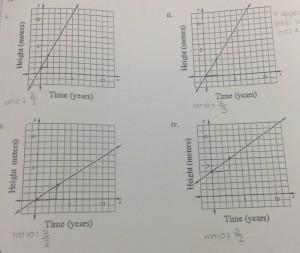
Today in class we learned about what slope was. The slope of a line is the ratio of the amount that y increases as X increases the some amount. You can find the slopes after drying in line. You have to find the two points that are in the exact point. Then you draw a triangle to make the other point and you find yourself you will come up the side and at the bottom and the number on the Y axis will always go on top.
Blog #25 line from data points
In class we learned how to find the equation in y=mx+b from a graph. The coordinates of each point on the line will solve the equation for you. But you have to substitute it for x and y. The equation of a linear equation can be written in y=mx+b form. M is the slope of the line and B would be the y intercept.
Blog #26 describing associations
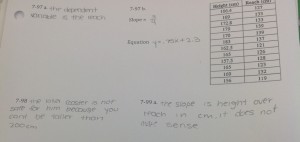
Today in class we learned how to describe different associations with different graphs. You first have to examine the table then find the slope of it. After you find the slope you also want to find the y-intercept. When you have those two things you can now come up with an equarion for your table. With this informarion you can find any other question its asking for like if the slop is higher than the reach.


Leave a Reply