Associations
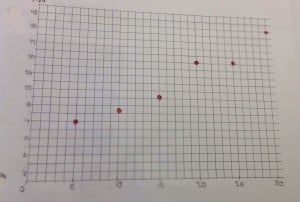
A graph can help you associate between two sets of data by showing the growth of something and the scale. If theres an association with two different sets of data than they are similar to each other. If there isn’t an association with the data then they are not similar or they don’t look alike. Some association forms are having similar tables, graphs and more.
Slope and Steepness
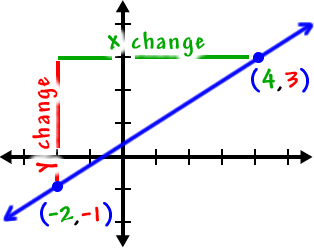
A slope is where a line meets in the x and y point.you can find a slope by knowing where a line meets up with the x and y corner. The slope would be different because you need to know how far each point is away from each other. The line would be different because it wont have the same slope because it can be steeper.
Line from Data Points
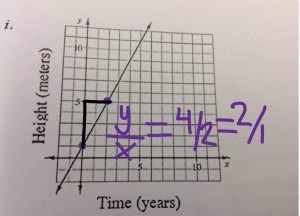
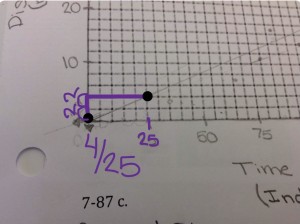
You can find a y=mx+b in a graph by finding the y-intersept and the slope. The slope can be found easily by knowing how the graph is growing by. The y-intersept can be found when a number hits the y axis on the line. After you have found those then you need to put m as the growth and b as the y-intercept.
Describing associations
When your describing an association you need a graph, a table, a rule or an equation. You need all thise for to write an association to find out what the people need to know. An equation gives you the growth of the problem and the y-intercept. An equation can be more useful when your writing the table because it can help you find the answer faster.


Leave a Reply