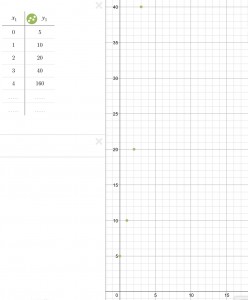
Let me first describe how to recognize a proportional relationship in a table. First off you have to find if you can start at a origin (0). Immediately after you discover the first number it can change the problem, let’s pretend Sally has a interest account but he first ever amount she put in there was $5 and the account doubles each year, this meaning this can be proportional because the origin is 0 and $5. Now also on the table if you notice that every number has the ability of a being multiplied by the same number, let’s me use Sally as another example. So at first she begins with $5 it will eventually be $10 but because it doubles each year I will get $20 next time but that would be proportional because if you were to double from the fourth year (third being $40) you you get $80 so every time you can multiple the number on the right by 2 but the problem is that when you multiple the right side (years) then you you find 2 does not multiple into each number, so immediately after we know that it will be in proportional. The third thing that you would find is if it is a straight line, if the relationship is proportional then we find out that the table evidentially become a line on a graph then it is a sign it is proportional. Next you must find a constant growth in a graph to be able to consider it proportional, again Sally has a doubling interest account so you could say she does have a constant growth because until she pulls money out of the account the money will be constantly increasing. The finial thing that you can see for a proportional relationship is the proportional relationship must be true, again Sally has five dollars but if she were to compare it to a graph or table it has to show that when finding both sides are able to be multiplying by the same number each time, sadly Sally’s table is incorrect because when you look it goes from one to two then three there are no multiples that can be multiplied by two to make three. Unit rate is the finial thing I will explain, when looking in any graph it should either give you a x and y axis number, or at least a close estimate, but when looking at the graph you can at least make two set of numbers when finding a unit rate but when u need to find one you can subtracts the x/y axis from the other x/y to find what you need to add to find the unit rate witch is the number you add to the previous number to get the next number in a set of numbers.


Leave a Reply