


In my math class today what we did was a rubber band pumpkin time bomb, where we got a pumpkin and we would put rubber bands around it until it explodes.
The weight of the pumpkins.
-For the correlation of the pumpkins it was a negative trend.
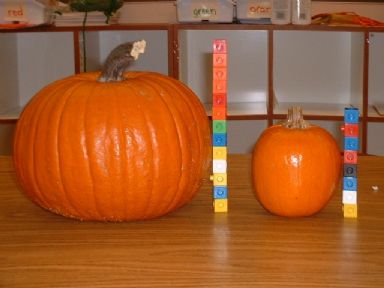
– A picture to relate to weight is down below.

-Here’s a picture of our graph

-It’s a negtive trend because the number of rubber compared to the weight is because the weigh was smaller compared to all the rubber bands.
The height of the pumpkins.
– For the height of the pumpkins it was also a negtive trend.
-Here’s a picture of height with a pumpkin.
-Here’s our graph for the height.

-Why it is a negtive trend because the height of most where smaller then all the rubber bands so after graphing how many rubber bands to height, is smaller.
The circumference of the pumpkins.
-The trend for circumference was also negative. (Probably all of them are goign to end up negative)
-Here’s a picture ( of a pumpkin )

-Now here’s a graph

-Why is it a negtive trend because when comparing the circumference it’s smaller to the number of bands so most of the points are dropping.
Only 4 more for you reader. Now here’s the diameter.
-For diameter the trend was a negative one as well as the ones above.
-Here’s a picture

-Then here’s the graph

-Why it’s a negative trend is because when your diameter is smaller then the number of rubber bands it’s negative trend.
Now more diameter ( interal diameter )
-For the interal diameter it is a negative trend.
-Picture of a pumpkin.

-Here’s our graph

-Why it’s also a negative trend is because of how the graph show the points from the left going to a negative effect, because of all the different pumpkins.
The Rind Thickness
-The rind thickness of the pumpkins was actually a positive trend.
-Here is a picture of a pumpkin again

-Here is our graph
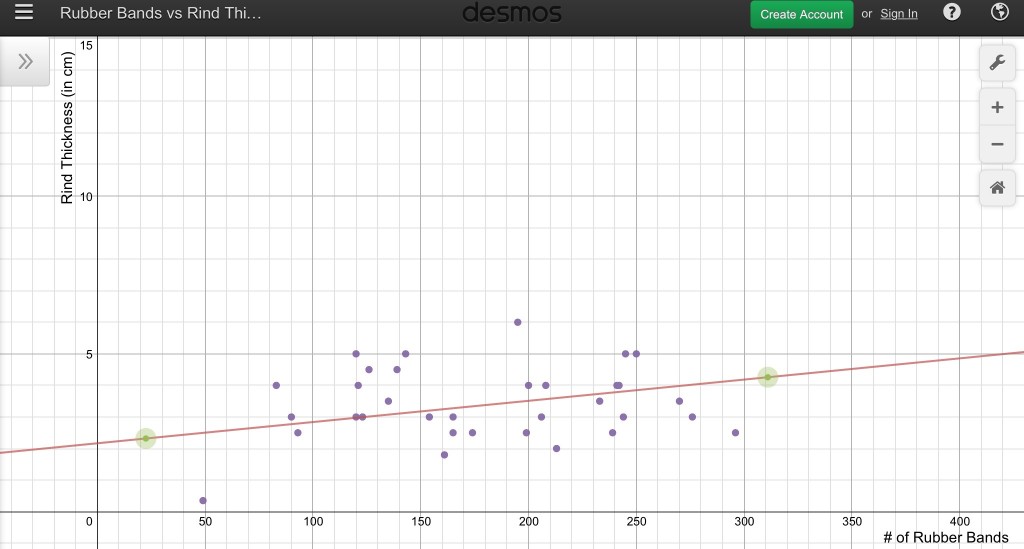
-It’s a postive trend because of the way the points increase then the numbers of the rubber bands so it makes it a positive trend.
Oh I forgot Rubber Band Length.
-The trend for the rubber bamd length was a trend where everything was almost was the smas but it ends up being a negative trend.
-Look a picture of rubber bands!!

-Here is a picture my graph.

-Why it’s a negative trend is because even though the length and the number of rubber bands are similar there is more points that are dropping so it’s negative.
Questions
-My prediction was that I thought that the circumference was going to effect the pumpkin, because the bigger the pumpkin was the easier it would pop, which might be ture because compared to other pumpkins my groups pumpkin was small and it took a while to break, maybe about 245 something around that number.
-What I ended up learning from this experiment was that something a little as a rubberband can pop a pumpkin, also about the factors that effect the trends from being postive and negative.
Here is a quick video of our pumpkin experiment.
Leave a Reply