Blog 16: Residuals
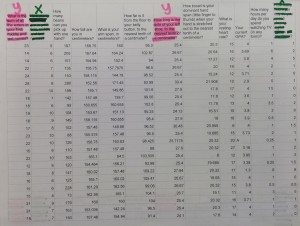
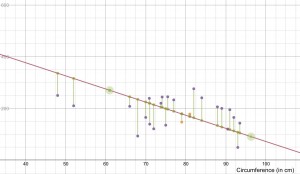
 A residual is the difference between the actual value and the predicted value. We learned that if you are dealing with a scatterplot you would make a line of best fit. So, the residual would be the actual value subtracted with the predicted value from the line of best fit. The equation is actual – predicted = residual. The picture shows a bunch of data, once we put it into a table it showed us the line of best for and we were able to find all of the residuals.
Blog 17: Residual Plots
 The residual’s purpose is to show how close the actual and predicted values are. On demos you would make the table with all of your information, then plug in the equation y1~mx1+b. This would give you the line of best fit. After that you would click the button that says plot residual’s and it would give you a line between your actual and predicted values. This shows you how far they are from each other and how accurate the data is.
Blog 18: Correlation Coefficient, r
The value of correlation coefficient shows how strong the line of best for is. If “r” is close to zero that means the line of best fit is weak and the data is not very close together. If it is at zero the line would be horizontal. If the value of “r” is close to 1 or -1 then the line is strong. Basically if the correlation coefficient is close to 1 it’s strong and if it’s closer to 0 it’s weak.


Leave a Reply