


Blog 23: Associations
The grath can help you tell if theres an association or not because of points would match the data. If there were an association, either the points would increase or decrease. If there isnt an association than there would be an increase nor would there be a decrease, the pounts would just be scattered everywhere. Theres two types of associations theres a negative and positive association. A positive association would increase and a negative association would decrease. An outiller is a umber that might be really big or small compared compared to the rest of the data.

Blog 24: Slope and Steepness
A slope is a number that tells the growth and steepness of the line. To fine the slope you find two numbers from the y axis and x axis. For instance, like of the run is 3 and the rise is 8 than it’ll be rise over run therefore the slope will be 8/3.

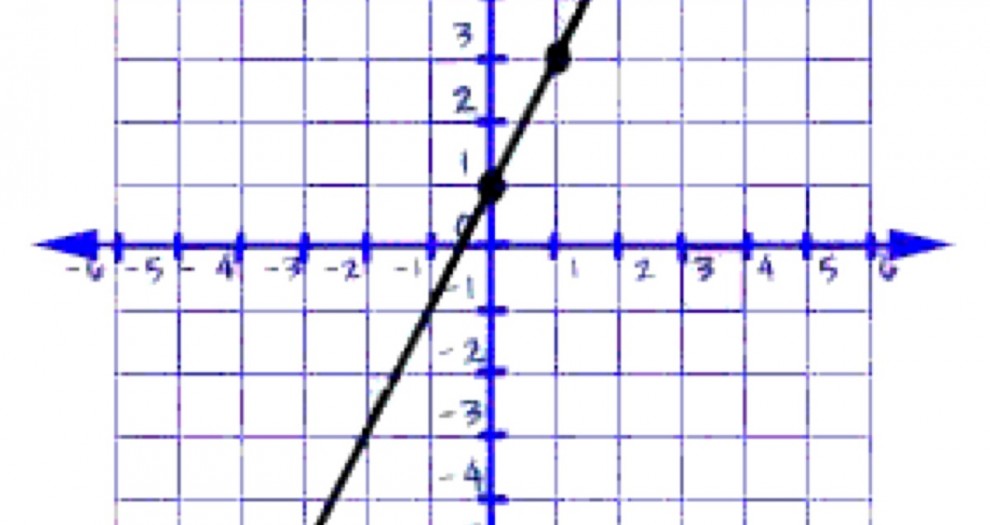
Blog 25: Line from Data Points
The equation y=mx+b form isnt hard to uderstand. The M stands for the growth of the line. The B stands for the y-intercept. For example, lets say the equation is y=2x+5, the growth would go up by 2 and itll start at 5 where is intercepts through the y-axis.

Blog 26 : Describing Associations
The things you need to make an association to a graph is the y-intercept, the slope, the table, and the y=mx+b. An equation from a y=mx+b form tells you the slope because the slope is the growth (m) in the equation. An equation may be easier to find the slope than finding it on the graph. The slope will tell you if it either decreasing or increasing.

Leave a Reply