Blog #23 Associations
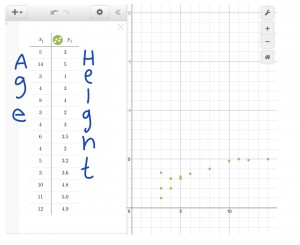
What an association is basically a relationship between to labels or x and a y. For example an association on a graph can be how tall someone is compared to how old they are. Moreover in an association you graph the data with a scatterplot and depending on where the data lines up it can be a negative association or a positive one. Now I’m going to show you a picture example with age and height.
Blog #24 Slope and Steepness
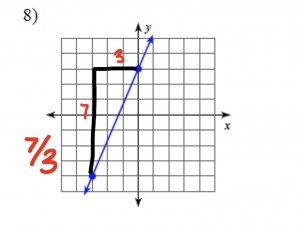
What a slope is a how much a figure grows or decrease by one x unit. Also if the line on the graph was steeper that would mean the graph would have a longer and larger slope. Lastly I’m going to show you a graph with a slope and the growth of 7 for every 3 figures.
Blog #25 Line From Data Points
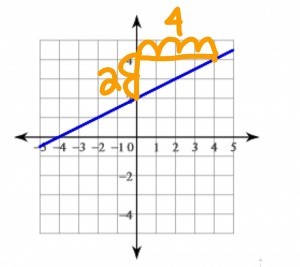
How to find an equation of a line in y= mx + b form from just a graph when you have a slop from each points is when you find two points and compare the slope which is the growth between each figures. Like on this graph when comparing the two points finding the slope it’s 2/4 which is the growth which is only half of the equation, to find out the rest is just where the line hits the y axis which is 2. So the final equation is 2/4x + 2= Y.
Blog #26 Describing Association
When you have an association the four things you need to think about is: Is there a relationship? What is the equation? What is the slope? And lastly how would the data look like in a graph. Some examples is a relationship between the height of someone and the reach, the dependent variable being the reach while the height is the independent variable. The slope for this is 7/10. A Graph and table is going to be the picture shown below.


Leave a Reply