Blog prompt #29 – Investigating y=b^x
What we learned today was how the value of “B” affects the value of “Y”. First of all, “B” is going to be the power of “X”. For example, if “B” is “3” and “X” is “2” you would have it be ” 3 x 3″ or “3^2” which would change the value of Y
Blog Prompt #30- Multiple Representations Web for Exponential Functions
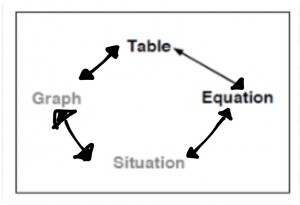
In an exponential function web, it shows the different ways that a specific situation is shown. For example if you have an equation, you can use it and figure out what to put into an equation. Or you can also use it by putting it into a graph. Sometimes you can even use a table to put it into a graph. As shown in the picture, we can use one thing from the web into another thing.

Blog Prompt #31 – Updated Web for Exponential Function
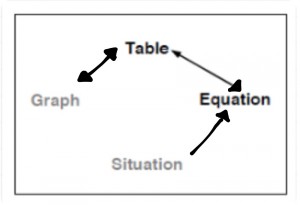
Yes, in the Web for Exponential Functions i made the arrows go back and forth for Graph and table because you would need a table to figure out what to put into the graph. Also it can go back and fourth with the table and equation because in order to figure out the table you need the equation to put the things as in input. It is also easy to figure out the equation in a table. The only thing for situation, i made it one way, because if you have a situation, you can make and equation.
Blog Prompt #32 – Graph -> Equation for Exponential Functions
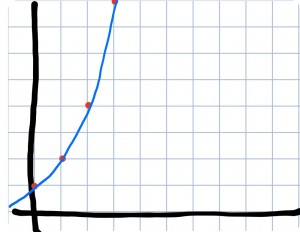
The method that i use for writing an exponential equation is that i first look at the y-intercept. After i figure out the starting point, i check to see if by any chance the graph is linear, but since it is an exponential equation, it is not going to be linear. For example if the graph is like this, i see that it starts at 1 and doubles as it goes up, so the equation would be y= 4(x) ^2
Blog prompt #33 – Important Ideas about Exponential Functions
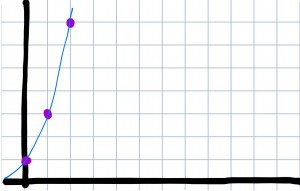
If i were to do a presentation for portfolio night, i would first start them off by showing them all the lessons that i have from this unit. Second i would explain how an exponential function is represented on the graph. For example on this graph. Like that it doubles for every unit on the X-intercept.


Leave a Reply