Representations of patterns web
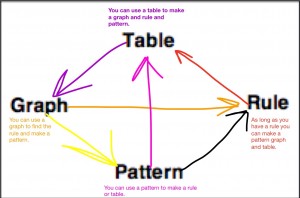
table:You can use a table to make a graph and rule and pattern. Rule:As long as you have a rule you can make a pattern graph and table.Graph:You can use a graph to find the rule and make a pattern.pattern: You can use a pattern to make a rule or table.
Connecting linear rules and graph
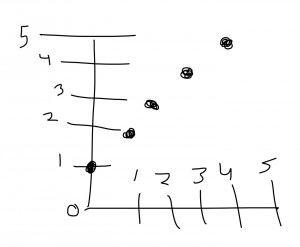
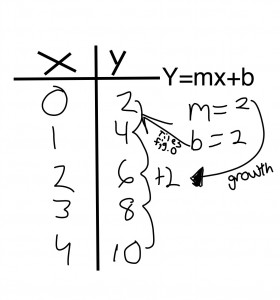
A growth is shown in a graph by how many times it goes down or up to the next number if it’s positive or negative. To find a growth in a rule is to look at the number in front of x and the number adding. You can determine the number of tiles in figure 0 on a graph is if the plot dot is on the y axis. To determine how fast a pattern grows on a graph is by the numbers for each figure.
Y=mx+b
What is y=mx+b
M stands for the growth in a pattern or table and B stands for the number of tiles in figure 0.
Graphing without an x and y table
In order to graph with a rule such as y=4x+2 you already know what 0 is going to be which is 2 because the two stands for how many tiles in fig 0 and you would keep plotting by adding for to each number. In order to increase you go up four times and in order to decrease you go down four times.


Leave a Reply